Columns and Rows are the most important concepts in the world of data management and organization. The columns and rows template is an essential tool that provides a structured framework for arranging and presenting data in a logical and systematic manner. By utilizing these free templates, you can streamline your data management processes and make informed decisions based on well-organized and easily accessible information.
One of the key advantages of using columns and rows templates is that they offer a structured framework for data entry. With predefined columns and rows, you can easily input data into the designated cells, ensuring that information is organized and accurately recorded. This saves time and minimizes errors, as the template guides you in entering data in the appropriate fields. In this article, we will explore the benefits of using columns and rows templates and how they can enhance your data management capabilities. See our collection of Columns and Rows Templates in PDF format to organize your data in a systemic way.
A column can be thought of as a vertical line containing cells that all share the same type of information. For example, if you have a spreadsheet tracking employee information, each column would contain specific pieces of data about each employee. That data might include name, age, position title, salary, etc. Each column should contain only one type of data, however, it can contain multiple pieces of that same type of data (e.g. name column can have John Smith and Jane Doe).
A row is the opposite of a column in that it contains cells that all share related information but across different types or categories rather than within them. For example, if you have a spreadsheet tracking employee information your row would track one particular employee’s data across all columns (name, age position title, salary, etc.). A row will always contain the same number of cells as there are columns on your spreadsheet or database table.
Differences between Columns and Rows
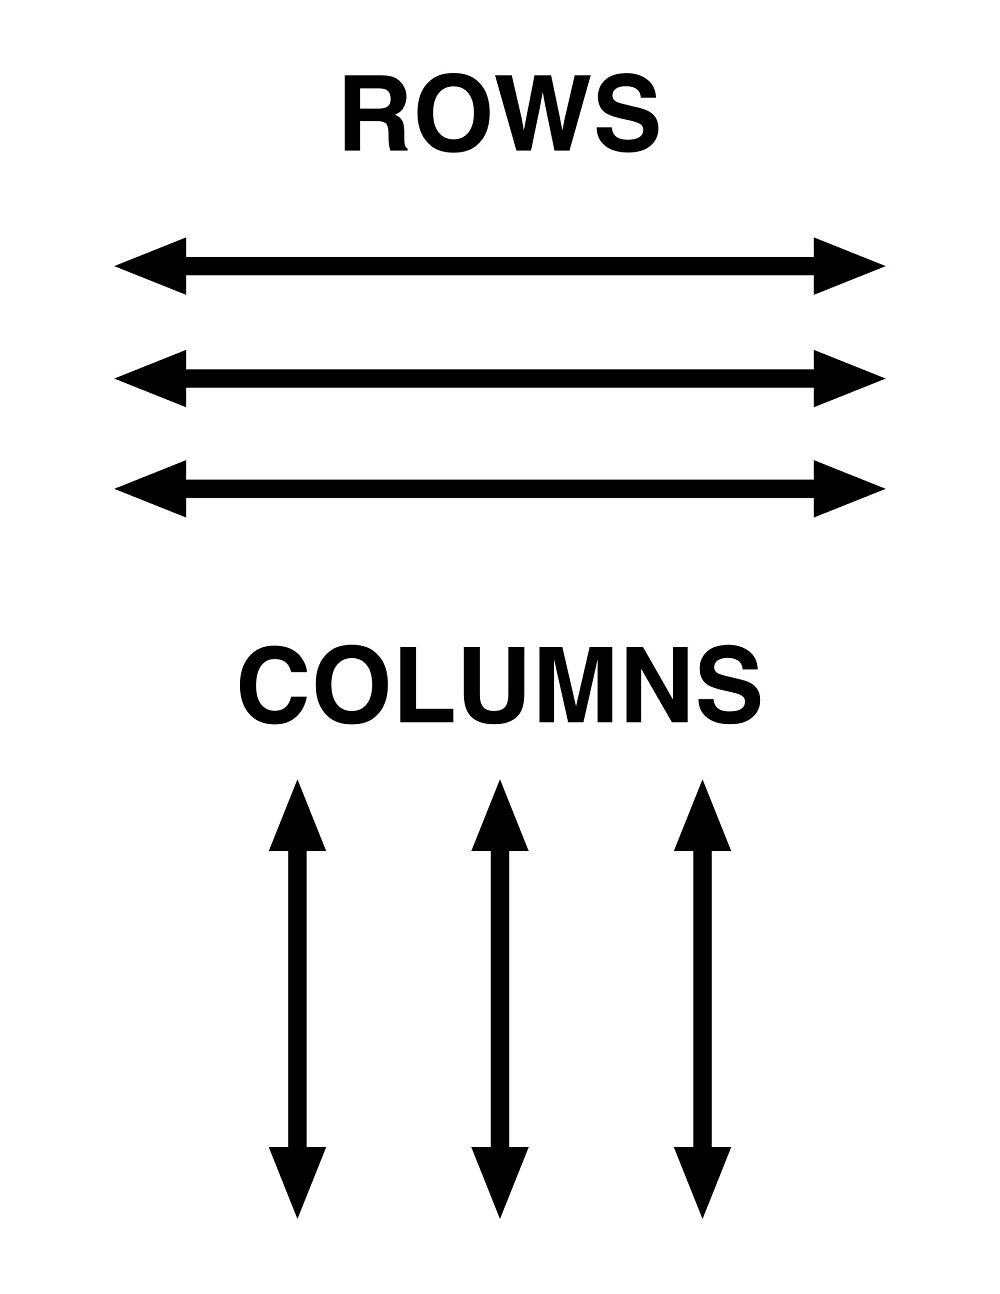
A significant difference between columns and rows is that columns are used to organize information vertically whereas rows are meant to store data horizontally. This means that when data is placed into a column, it lines up from top to bottom, whereas when it is placed into a row, the data lines up from left to right. Additionally, columns can contain different kinds of information than what would be included in a row. Columns and rows are essential components of data organization, particularly in tables or spreadsheets. While they work together to structure and present data, there are key differences between them. Let’s explore the distinctions:
Orientation: Columns are vertical structures, running from top to bottom, while rows are horizontal structures, extending from left to right. Columns provide a vertical arrangement of data, while rows offer a horizontal organization.
Function: Columns typically represent different data categories or variables. Each column is dedicated to a specific attribute, such as names, dates, or quantities. Rows, on the other hand, contain individual data entries or records corresponding to each category represented by the columns.
Data Representation: Columns are commonly used to display categorical or qualitative data, such as names, categories, or descriptions. They can also represent numerical data, such as quantities or measurements. Rows, on the other hand, are used to display individual data entries or records associated with each category represented by the columns.
Data Manipulation: Columns provide a basis for performing calculations, applying formulas, or aggregating data. With columns, you can perform operations like summing, averaging, or sorting data within a specific category. Rows, however, allow you to access and manipulate individual data entries within a dataset.
Data Organization: Columns play a vital role in organizing data in a consistent and logical manner. They provide a structure for categorizing and labeling information, making it easier to locate and reference specific data points. Rows, in turn, allow for the detailed representation of individual instances or records within each category.
Data Analysis: Columns are particularly useful in data analysis as they allow for comparisons between different data categories. By aligning similar data elements in columns, you can easily compare values, identify patterns, or perform calculations within a specific category. Rows, on the other hand, aid in examining individual data points or records.
Columns and rows have distinct characteristics and functions in data organization and presentation. Columns represent data categories or variables, while rows contain individual data entries corresponding to each category. Columns enable data manipulation, comparisons, and calculations, while rows facilitate access to and analysis of individual data points. Understanding the differences between columns and rows is crucial for effectively managing and analyzing data in various contexts.
Benefits of Using Columns and Rows in Data Analysis
Columns and rows are powerful tools when it comes to analyzing data. They help you quickly organize information in an efficient manner that can be used to make decisions and create strategies. Whether you’re a business owner, a data analyst, or a marketer, understanding how to use columns and rows can help you get the most out of your data. Here are some benefits of using columns and rows for data analysis.
1. Organization & Clarity
The main benefit of using columns and rows is that it clarifies your data analysis. By organizing your information into different categories, you can easily see patterns and trends in your data that would otherwise remain hidden. For example, if you have sales data from the past year broken down by month, you can easily spot which months had the highest sales numbers by looking at the column containing each month’s sales numbers. This makes identifying areas where improvement is needed or opportunities for further growth easier.
2. Data Visualization & Presentation
Another benefit of using columns and rows is that it makes it easier to visualize your data. Thanks to tools like spreadsheets and charts, it’s much easier to create visuals that clearly illustrate trends in your data than if you were trying to do so with raw numbers alone. This makes presenting your findings much simpler as well since all your key points can be shown clearly in one visual representation instead of having to explain them step-by-step with words alone.
3. Accessibility & Collaboration
Finally, another advantage of organizing your data into columns and rows is that it makes accessing and sharing information much easier than storing it in one large jumble of numbers or text. Spreadsheets allow multiple people to access the same document at the same time, making collaboration much more efficient than ever before. In addition, many spreadsheet programs come with built-in features such as formulas, which simplify analyzing large amounts of data.
4. Data Analysis Efficiency
Columns and rows templates streamline the data analysis process. With predefined columns and rows, you can readily apply analytical techniques, perform calculations, and conduct statistical analyses. This efficiency saves time and effort, allowing for a more productive and accurate data analysis workflow.
Importance of Columns and Rows in Data Organization
Columns and rows are integral components in organizing data, as they provide the necessary structure for effectively organizing information. Without columns and rows, it would be difficult to make sense of data, as related pieces of information would not have any systematic way of being organized. When searching for relevant pieces of data, it is much simpler and more efficient to look through a column or row rather than sorting manually through an unorganized format.
Columns and rows play a crucial role in organizing data effectively and efficiently. They provide a structured framework for data organization, allowing for easy navigation, analysis, and interpretation. Here are some key reasons why columns and rows are important in data organization:
Data Structure: Columns and rows provide a clear and consistent structure for organizing data. Columns represent different data categories or variables, while rows contain individual data entries or records. This structure ensures that data is organized in a systematic and logical manner, making it easier to understand and work with.
Data Categorization: Columns allow for the categorization and classification of data. Each column represents a specific attribute or characteristic, such as names, dates, quantities, or descriptions. Categorizing data into columns enables efficient searching, sorting, and filtering of information based on specific criteria.
Data Accessibility: Columns and rows facilitate quick and easy access to specific data points. By locating the relevant column and corresponding row, you can locate and retrieve the desired information without having to search through an entire dataset. This saves time and effort when working with large volumes of data.
Data Comparison: Columns enable the side-by-side comparison of data variables or categories. By aligning similar data elements in columns, you can easily compare values, identify patterns, or analyze relationships between different attributes. This comparison is valuable for data analysis, decision-making, and identifying trends or insights.
Data Analysis and Calculation: Columns provide a foundation for data analysis and calculations. You can perform various mathematical operations, apply formulas, or aggregate data within individual columns. This allows for calculations, statistical analysis, and deriving new insights from the data.
Data Presentation: Columns and rows create a visually organized format for presenting data. Tables or spreadsheets with clearly labeled columns and rows make it easier for others to understand and interpret the information. This is particularly important when sharing data with colleagues, stakeholders, or clients.
Data Integrity: Columns and rows help maintain the integrity of the data. Each column has a specific purpose and data type, ensuring consistency and preventing errors in data entry. This structure ensures that data remains accurate, reliable, and coherent throughout the dataset.
How to Utilize Rows and Columns Templates
Utilizing row and column templates can significantly streamline your data organization and management process. Here’s how you can make the most of row and column templates:
Select a Suitable Template: Choose a row and column template that best fits your data organization needs. There are various templates available, ranging from simple spreadsheets to complex. Consider the specific data you need to manage and the level of complexity required.
Customize the Template: Tailor the template to suit your specific requirements. Modify column headers to reflect the relevant data categories or variables. Add or remove rows and columns as needed to accommodate your data. This customization allows you to align the template with your unique data organization needs.
Enter Data: Start populating the template with your data. Enter values, texts, or numbers into the corresponding cells. Follow the predefined structure of the template to ensure consistency and coherence in your data entries.
Format and Style: Apply formatting and styling options to enhance the visual appeal and readability of your data. Use font styles, colors, and cell formatting to differentiate data categories or highlight important information. Utilize conditional formatting to automatically format cells based on specific criteria, such as color-coding for data ranges or highlighting duplicates.
Conclusion
In conclusion, columns and rows templates play a crucial role in data organization and management across various domains. By utilizing columns and rows, you can enhance the efficiency of data entry, analysis, and retrieval processes. The benefits of using columns and rows templates include improved data organization, enhanced readability, streamlined data analysis, and simplified data maintenance. They provide a clear and systematic way to organize, sort, and filter data, enabling easier data management and informed decision-making. Whether you’re a business professional, researcher, student, or anyone dealing with data, columns, and rows templates offer a practical and effective solution for managing and organizing data effectively.


")


")

